A Closer Look at the Eight Leading APM Tools: Who Wins?
Lightning-fast response times and zero outages are every website owner’s dream. However, for many, this dream is overshadowed by the nightmare of performance issues and endless hours wasted on manual troubleshooting. But here's the good news – application performance management (APM) tools are here to relieve you from this stress.
These powerful tools help developers and IT professionals monitor and manage the performance of their applications, providing insights to keep everything running smoothly.
This article will explain the benefits of using APM tools and introduce you to the top eight contenders in the market.
Why APM Tools Are Not Just a Choice but a Necessity
APM tools are essential software solutions designed to monitor and optimize the application performance. Their primary purpose is to ensure that applications run smoothly and efficiently by providing:
- Real-time monitoring: Continuously track the performance of applications to ensure they are running optimally.
- Anomaly detection: Identify unusual patterns that could indicate potential issues before they escalate.
- Root cause analysis: Pinpoint the exact cause of performance problems, making it easier to resolve them.
- Performance optimization: Provide insights and recommendations to enhance application performance.
These functionalities are vital in maintaining application reliability, ensuring user satisfaction and business impact. Without APM tools, organizations often face significant challenges like:
- Difficulty in identifying performance bottlenecks: With proper monitoring, pinpointing the source of performance issues can be difficult.
- Prolonged downtime: Lack of quick detection and resolution capabilities can lead to extended periods of application downtime.
- Poor User Experience (UX): Slow or unresponsive applications can frustrate users, leading to dissatisfaction and churn.
These issues can result in lost revenue, reduced productivity and damaged brand reputation. However, by implementing APM tools, you can spot and address potential problems before they impact users and optimize applications for better speed and reliability.
As the APM landscape continuously evolves, advanced features like AI-powered anomaly detection and automatic dependency mapping are now commonly used. These innovations provide deeper insights and more accurate issue detection, enhancing application performance.
Additionally, integrating APM tools with other elements of the tech stack, such as CI/CD pipelines and cloud services, is increasingly important. This helps create an optimized workflow, ensuring that performance monitoring is integral to the development and deployment process.
Top APM Uses and Metrics
User Monitoring
User monitoring tracks user interactions and behaviors to understand the end-user experience. It helps identify performance bottlenecks and areas for improvement from the user's perspective.
Key User Monitoring Metrics
- Page load times: Measures how long it takes for a web page to load fully.
- User session duration: Tracks the time users spend on the application.
- User journey mapping: Visualizes the paths users take through the application.
- Error rates encountered by users: Monitors the frequency and types of errors users experience.
Transaction Profiling
Transaction profiling involves analyzing the performance of individual transactions within an application. It's essential for identifying specific transactions that may be causing slowdowns or errors.
Key Transaction Profiling Metrics
- Transaction response times: Measures the time it takes to complete a transaction.
- Throughput: Tracks the number of transactions processed over a given period.
- Error rates: Monitors the frequency of errors during transactions.
Component Monitoring
Component monitoring focuses on the health and performance of specific application components. It ensures that each component functions correctly and efficiently.
Key Component Monitoring Metrics
- Component response times: Measures how quickly each component responds.
- Error rates: Tracks the frequency of errors in each component.
- Resource utilization: Monitors each component's usage of resources like CPU, memory and disk.
Infrastructure Monitoring
Infrastructure monitoring ensures that the underlying hardware and network resources are functioning optimally. This is critical for maintaining the application's overall health and performance.
Key Infrastructure Monitoring Metrics
- Server CPU usage: Measures the percentage of CPU capacity being used.
- Memory usage: Tracks the amount of memory in use.
- Disk I/O: Monitors the input/output operations of the disk.
- Network latency: Measures the delay in data transmission across the network.
Analytics
Analytics provide deeper insights into application performance and user behavior through data analysis. This enables data-driven decision-making and proactive performance management.
Key Analytics Metrics:
- Customizable Dashboards: Visual displays of key performance indicators.
- Trend Analysis: Identifies patterns and trends in performance data.
- Predictive Analytics: Uses historical data to predict future performance issues.
SLA Monitoring
SLA monitoring ensures that service level agreements (SLAs) are met by monitoring performance against predefined criteria. This is critical for maintaining trust and satisfaction among users and stakeholders.
Key SLA Monitoring Metrics
- Uptime: Measures the percentage of time the application is operational.
- Response Times: Tracks how quickly the application responds to requests.
- Error Rates Compared to SLA Targets: Monitors errors against SLA benchmarks.
CPU Usage
Monitoring server CPU usage is crucial to ensuring efficient resource utilization. High CPU usage can indicate performance issues and potential bottlenecks.
Key CPU Usage Metrics
- CPU utilization percentage: Measures the proportion of CPU capacity being used.
- Load averages: Tracks the average system load over a period.
- Process-level CPU usage: Monitors CPU usage by individual processes.
Response Times
Measuring the time it takes for the application to respond to user requests is critical for ensuring a smooth and responsive user experience.
Key Response Times Metrics
- Average response time: The mean time taken to respond to requests.
- Peak response times: The maximum time taken for the slowest requests.
- Response time distribution: The spread of response times across all requests.
Error Rates
Tracking the frequency of errors occurring within the application is essential for maintaining application stability. High error rates can indicate underlying issues that need to be addressed.
Key Error Rates Metrics
- Error rate percentage: The proportion of requests that result in errors.
- Types of errors: The various errors encountered within the application.
- Error trends over time: Patterns in error occurrences over a period.
Comparing the Top Eight APM Tools
New Relic
Image
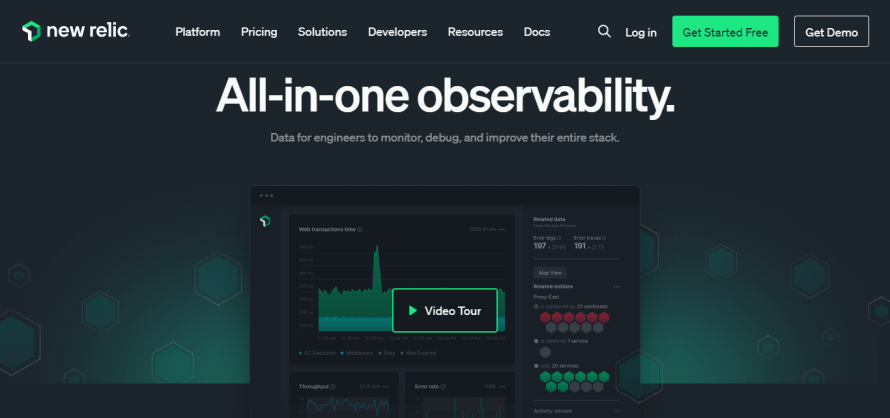
New Relic is a powerful full-stack APM tool that provides comprehensive application monitoring and analytics. It instantly monitors golden metrics (or the four golden signals), visualizes dependencies and spots alerts and error-tracking issues. These golden metrics are:
- Latency: The time it takes to service a request. This includes the time taken by all components involved in fulfilling the request, such as network latency, processing time, etc.
- Traffic: The amount of demand or load on the system, typically measured in requests per second or the number of concurrent users.
- Errors: The rate of requests that fail, including explicit failures (like HTTP 500 errors) and implicit failures (like an HTTP 200 success response with the wrong content).
- Saturation: How "full" the system is, i.e., the current utilization of resources like CPU, memory, disk I/O, network bandwidth, etc., relative to the total capacity available.
You can also see user experience metrics for key transactions (e.g., login process or checkout process) and synthetic checks (e.g., simulated user interactions or performance browser stress). Not to mention, debugging becomes faster with a unified view that includes infrastructure metrics and distributed tracing to find root causes.
New Relic integrates smoothly with Pantheon, offering detailed performance insights and real-time data. More on that later on in this post.
One downside of New Relic is that it can present a bit of a learning curve for new users who are unfamiliar with APM tools. But with the right support from platforms like Pantheon, this will not be an issue.
New Relic gives you a usage-based pricing model based on the amount of data ingested and the number/type of users. The three user types are:
- Primary users: Free, view dashboards/alerts
- Core users: Start at $49/user/month, access to logs, errors, etc.
- Full platform users:
- Standard Edition: 1 free, then $99/user/month (max 5 users).
- Pro Edition: Custom pricing, no user limit.
- Enterprise Edition: Custom pricing and additional features.
The first 100 GB of data ingestion per month is free for data pricing. After that, you have two pricing options:
- Original Data: $0.30/GB ingested (includes 30 days retention)
- Data Plus: $0.50/GB ingested (consists of 90 days retention and advanced features)
Fortunately, you don’t have to worry about all these numbers if you're using Pantheon. You’ll get all of New Relic’s performance monitoring capabilities at no additional cost!
AppDynamics
Image
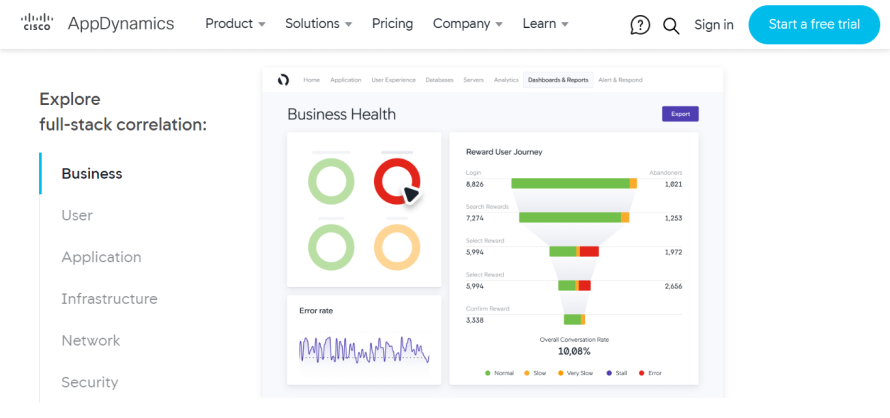
AppDynamics, developed by Cisco, is a full-stack APM and IT operations analytics (ITOA) platform that provides real-time monitoring and business insights across an organization's entire technology stack. It focuses on managing the performance and availability of applications across cloud computing environments, IT infrastructure, network architecture, digital user experience, application security and data centers.
AppDynamics leverages AI and machine learning to provide AI-powered anomaly detection and root cause analysis, helping organizations align application performance with business outcomes.
While some users find AppDynamics to be a compelling and valuable APM solution overall, others have a couple of grievances, such as:
- Being quite expensive compared to some other APM solutions, especially for larger deployments.
- Not having an exceptionally user-friendly interface.
AppDynamics uses a CPU core-based subscription model with tiered pricing that can be expensive for larger deployments. However, it also offers an enterprise-grade feature set. Exact pricing will depend on the specific modules needed and the scale of the deployment, but there are four main subscription tiers (billed annually):
- Infrastructure Monitoring Edition: $6 per CPU core per month.
- Premium Edition: $33 per CPU core per month.
- Enterprise Edition: $50 per CPU core per month.
- Enterprise Edition for SAP Solutions: $95 per CPU core per month.
- Real User Monitoring: $0.06 per 1,000 tokens per month.
Datadog
Image
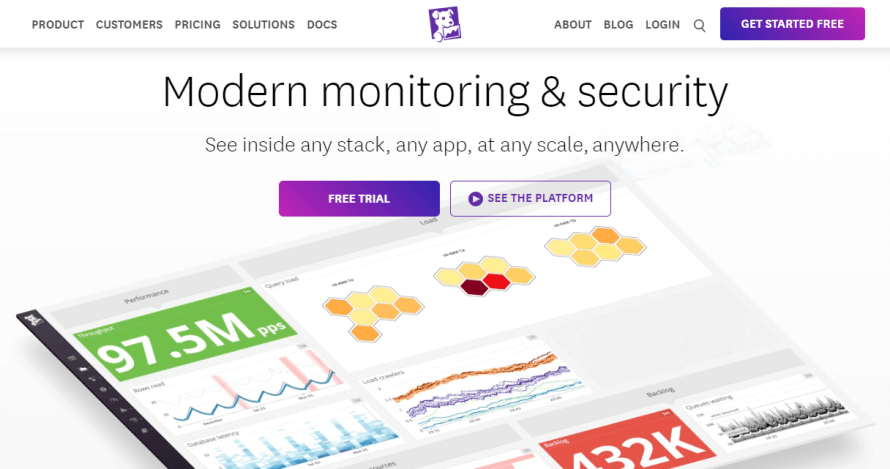
Datadog is a SaaS (software-as-a-service) platform designed to monitor cloud-scale applications. It brings together data from servers, databases, tools and services to provide full observability of the technology stack. The platform also includes infrastructure monitoring and log management, making it a comprehensive solution for modern IT environments.
Datadog’s APM capabilities offer detailed insights into application performance, helping teams optimize their software. Users can create customizable dashboards to visualize data from multiple sources to view their IT operations fully. The platform also provides alerting and notifications for detecting issues and anomalies, ensuring that teams can respond promptly to potential problems.
However, some users have found Datadog's user interface challenging, leading to time-consuming navigation struggles. Many users have also mentioned a steep learning curve for setting up and configuring Datadog across the entire software stack, making it more challenging for newcomers to get started.
Datadog's APM pricing ranges from $31 to $45 per monthly host.
Dynatrace
Image
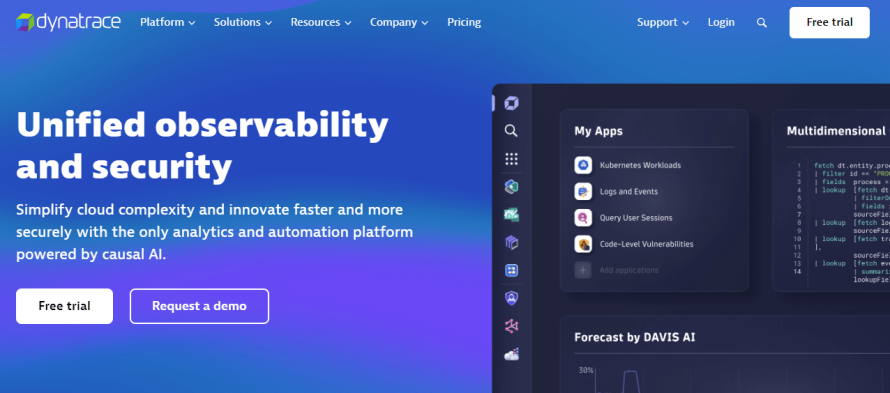
Dynatrace provides end-to-end observability and automation for cloud-native and hybrid environments. It leverages the Davis AI engine for AI-powered root cause analysis, automatically detecting anomalies and pinpointing issues.
Additionally, Dynatrace provides business analytics to understand the impact of performance on business outcomes, enabling data-driven decisions. It offers code-level visibility to identify performance bottlenecks, optimization opportunities and user experience monitoring for web, mobile and IoT applications to ensure availability and performance.
However, Dynatrace has some drawbacks regarding complexity, resource usage and cost.
Dynatrace uses a consumption-based pricing model called Dynatrace Platform Subscription (DPS). Customers commit annual spending and consume that based on actual usage and a rate card. The rate card has hourly prices for different capabilities, for example:
- Full-stack monitoring: $0.08 per hour for an 8 GiB host.
- Infrastructure monitoring: $0.04 per hour for any size host.
- Kubernetes monitoring: $0.002 per hour per pod.
Splunk
Image
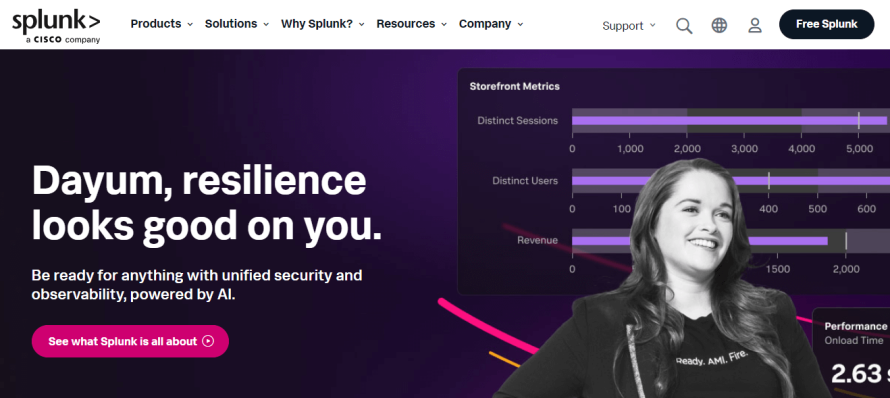
Splunk APM provides end-to-end visibility and AI-driven insights for monitoring and troubleshooting both microservices-based and monolithic applications. It uses AI-powered analytics to automatically identify anomalies and the sources of errors that most impact services and customers. Then, it delivers a 10-second resolution on metrics to detect and alert issues as they occur.
Splunk also employs a full-fidelity approach to ingesting all trace data, providing a comprehensive view of the system's state. It analyzes every transaction from both the backend and front end in context with infrastructure, business workflows and applications to more effectively identify problems in cloud-native environments.
Its AlwaysOn Profiling feature continuously analyzes how code impacts service performance, identifying the line of code responsible for slowness or crashes due to inefficient CPU usage or memory allocation. This feature is available for Java, .NET and Node.js applications.
Some users are complaining that Splunk's user interface is confusing and challenging to navigate. Restarting the Splunk process on local hosts consumes a significant amount of CPU and memory resources, impacting system performance and slowing down other operations. Users also complain about the limited flexibility and customization options available for dashboards, feeling restricted in creating custom metrics or performing detailed root cause analysis.
Splunk APM pricing starts at $55/host/month standalone or is available as part of the Observability Cloud suite starting at $60-75/host/month. The actual pricing can scale based on the number of hosts, data volumes and packages selected.
SolarWinds
Image
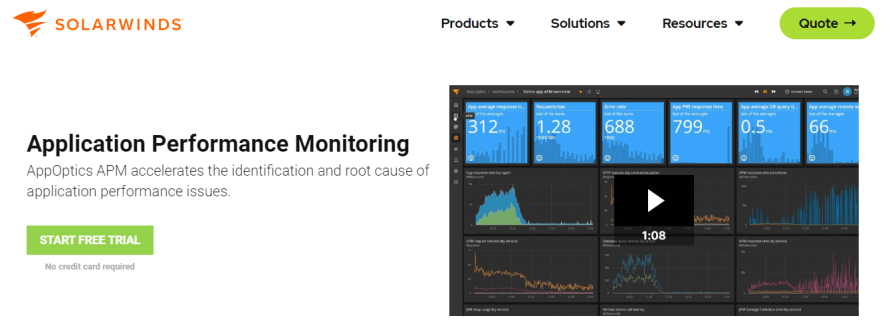
SolarWinds is a comprehensive suite of tools that provides end-to-end visibility and performance insights for custom applications running on-premises, in the cloud or in hybrid environments. It provides code-level diagnostics and transaction tracing for custom .NET applications on Microsoft IIS.
SolarWinds features intelligent alerts, root cause summaries and AI/ML-driven analytics to detect and resolve issues proactively. It provides distributed transaction tracing to identify performance bottlenecks and code-level diagnostics with live code profiling to pinpoint application issues. Additionally, it boasts broad support for cloud platforms, containers, open-source frameworks and over 150 technologies.
Users have expressed frustration with its user interface, describing it as needing to be clearer and easier to navigate, particularly for first-time users. Additionally, several users have criticized the documentation, finding it spotty and needing more detailed examples, which hampers their ability to understand and troubleshoot the software effectively.
SolarWinds uses a consumption-based pricing model with different tiers for infrastructure, applications, logs, databases and synthetic and accurate user monitoring. The total cost scales are based on the number of hosts, application instances and volume of data ingested each month. Detailed pricing for some tiers is disclosed by contacting sales.
Elastic APM
Image
Elastic APM is part of the Elastic Observability solution, which enables end-to-end application monitoring. Built on the Elastic Stack (Elasticsearch, Kibana, Beats, Logstash), it allows the monitoring of software services and applications in real time by collecting performance data on response times, database queries, external requests, errors and more.
It enables deep visibility into distributed applications, quickly identifying performance bottlenecks. Elastic APM also speeds up root cause analysis and troubleshooting of application issues and allows application performance optimization to improve the end-user experience.
Several users have expressed dissatisfaction with the need for more options to combine logs with log files and view all application information in one place, which hinders efficiency. Additionally, the user interface has been criticized for needing to be clearer and easier to navigate, adding complexity to their tasks and making the software harder to use.
While the core Elastic APM is free and open source, there are costs associated with running it in production, especially at scale in Elastic Cloud or with the advanced features in the Elastic subscriptions. The total price depends heavily on the scale of usage and data volumes. However, Elastic does provide a pricing calculator to help you estimate your costs.
Stackify Retrace
Image
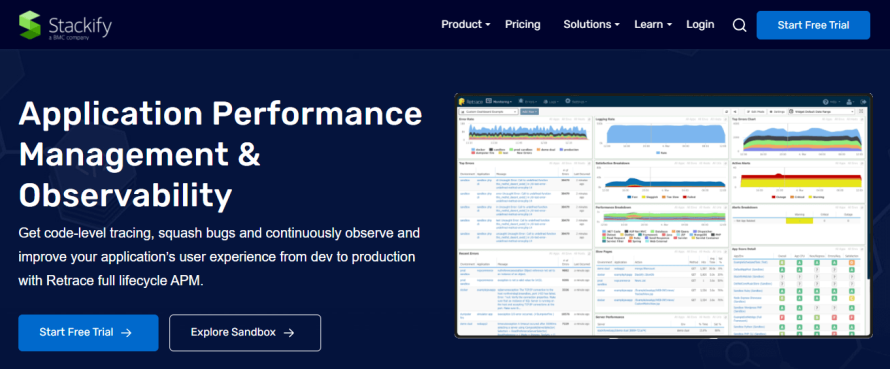
Stackify Retrace is a comprehensive APM solution designed specifically for developers. It provides end-to-end visibility and code-level insights to help quickly identify and resolve application performance issues.
Retrace also unifies traditionally siloed data from APM, logs, errors and server metrics into a single, easy-to-use interface built for developers. This consolidated view streamlines troubleshooting by eliminating the need to switch between multiple tools, improving efficiency and reducing tool sprawl.
While developers appreciate the deep code-level insights, Retrace provides, some CIOs and non-developer users find the user interface and dashboards busy and less intuitive than those of other APM tools.
Retrace uses a usage-based pricing model that scales based on the amount of trace and log data ingested, with some entry-level tiers for smaller servers. The base plan starts at $79-99/month, with additional usage billed on top of that.
Choosing the Right APM Tool for Your Organization
Here are some key considerations to help you make an informed decision when selecting an APM tool:
Ease of Integration
Consider how easily the APM tool can integrate with your existing technology stack. A smooth integration ensures you can quickly start monitoring and optimizing your applications without significant changes to your current setup. Look for tools that offer powerful APIs and pre-built integrations with popular platforms and services.
Scalability
Your APM tool should be able to grow with your organization. As your user base and application complexity grow, the tool should handle the additional load without compromising performance. Evaluate whether the tool supports scaling across multiple environments and efficiently manages increased data volume.
Feature Set
Ensure the APM tool offers the features you need for exhaustive observability. Essential features include real-time monitoring, anomaly detection, detailed analytics, transaction tracing and customizable dashboards. Assess whether the tool provides advanced capabilities like AI-powered insights, automatic dependency mapping and integration with CI/CD pipelines.
Cost
APM tools come with various pricing models, including subscription-based, usage-based and tiered pricing. Determine your budget and evaluate whether the tool’s pricing aligns with it. Consider both the initial cost and any potential additional costs for extra features, support or increased usage.
User Experience
Despite their powerful capabilities, APM tools suffer from the same Achilles' heel: a confusing user experience. This is precisely why opting for a user-friendly service with robust documentation and excellent support is recommended. APM tools can revolutionize your team’s productivity and dramatically reduce the learning curve.
When on the hunt for APM tools, seek out those offering intuitive interfaces, hassle-free setup and an abundance of resources like tutorials, guides and a support team that doesn’t ghost you.
Integration Challenges
Many companies encounter problems when they acquire tools individually and then attempt to integrate the data. This fragmented approach often slows down the performance process and complicates issue resolution. This is where Pantheon’s WebOps platform excels. With Pantheon, you get all the data in one view, on one platform, simplifying performance monitoring and optimization.
How Pantheon Integrates APM Effortlessly With New Relic
At Pantheon, we integrate New Relic’s monitoring capabilities directly into our platform, providing users with powerful APM features without the hassle of managing separate tools. This partnership is designed to be straightforward and user-friendly, allowing developers and site owners to gain valuable insights into their application performance with minimal setup.
Setting up New Relic on Pantheon is incredibly easy. Users can enable New Relic’s monitoring capabilities with just a few clicks and start collecting performance data. We handle the configuration process, ensuring that users can focus on optimizing their applications rather than worrying about technical details.
Here are the key benefits:
- Real-time monitoring: Pantheon users get real-time insights into their application performance. This immediate access to data means you can monitor your application’s health continuously and catch potential issues before they affect your users.
- Performance optimization: With detailed metrics at your fingertips, identifying and resolving performance bottlenecks efficiently becomes much more straightforward. New Relic’s advanced analytics help you pinpoint the exact areas that need improvement, enabling you to enhance your application’s performance efficiently.
- Unified dashboard: All performance data is accessible from a single, unified dashboard on Pantheon. This centralized view simplifies the monitoring process, allowing you to track key metrics, analyze trends and make informed decisions without switching between multiple tools.
- Automated alerts: Pantheon allows you to set up automated alerts for performance issues. These alerts ensure you are promptly notified of potential problems, enabling quick responses and minimizing downtime. Automated alerts help maintain the reliability and performance of your application, keeping your users satisfied.
New Relic just works out of the box. We were able to resolve issues that had been pestering us for years about the code base and led us to some pretty considerable code improvements.”
– Eric Toupin, Senior Developer at Aten.
Ensuring Optimal Performance With Pantheon
Using standalone APM tools often leads to integration challenges and data silos. These issues can complicate performance monitoring and slow down the optimization process. Pantheon overcomes these hurdles by providing a unified platform where all performance data is accessible in one place, ensuring easy tracking and optimization.
Pantheon’s suite of performance optimization tools is designed to ensure faster load times and a superior user experience. Here’s how Pantheon achieves this:
- Caching mechanisms: Pantheon employs advanced caching mechanisms to significantly speed up page load times by caching content at various layers. This reduces server load and ensures users receive content quickly, enhancing their overall experience.
- Performance monitoring dashboards: We provide intuitive performance monitoring dashboards that offer real-time insights into your application’s health. These dashboards display critical metrics and performance data, allowing you to continuously monitor and optimize your application.
- Database optimization techniques: Pantheon’s database optimization techniques ensure your application’s backend runs efficiently. By optimizing queries and managing database resources effectively, they minimize latency and enhance overall performance.
- Automated updates and backups: We offer automated updates and backups, ensuring your application runs the latest, most secure versions without manual intervention or downtime.
Learn more and watch our webinar about how these tools and the New Relic integration can transform your performance monitoring and optimization efforts!