How to Bridge KPIs and Website Performance Metrics to Boost Page Speed
Image
Marketing and developer teams often speak different languages and have conflicting priorities. However, many companies are discovering there are two sides to the same coin: every business KPI has a corresponding technical metric that directly influences its success.
Here are five high-level business KPIs and the website performance metrics you should track.
1. Ad impressions
Ad impressions directly drive revenue for ad-supported websites. More impressions mean more opportunities to monetize, but chasing raw numbers without considering user experience leads to diminishing returns.
Tracking the Cumulative Layout Shift (CLS) – using Google PageSpeed Insights – is how you balance user experience with monetization.
CLS measures how much a page’s content moves unexpectedly during load. When page elements shift because of poorly loaded ads, users get annoyed. They click away or install ad blockers – either way, you lose impressions and revenue.
A high CLS score indicates your ads are disrupting the user experience, which drives down engagement and limits the number of ads a user sees.
As such, you should aim for the lowest number you can, ideally below 0.1. Scores above 0.25 are considered poor and often indicate that ads are causing disruptions.
For example, reserving space for ads with fixed dimensions can significantly lower CLS scores. A site that improves its CLS from 0.3 to 0.1 could see its bounce rate drop, translating to longer sessions and potentially more ad impressions.
2. E-commerce revenue
E-commerce revenue depends on how fast and responsive your website is. Two metrics to monitor here are Interaction to Next Paint (INP) and Time to First Byte (TTFB).
INP measures how long it takes for your site to visually respond after a user interacts, e.g., by clicking a button, while TTFB measures how quickly your server starts sending data after a user makes a request.
Lower values for these metrics mean a faster and smoother user experience – a good INP is under 200 milliseconds, while a TTFB of under 100 milliseconds is ideal. Higher values for either metric mean delays in user interactions or data loading, which can lead to lower conversions and revenue.
💡 INP replaced First Input Delay (FID) as a Core Web Vital because it measures all interactions, not just the first, providing a complete picture of responsiveness. TTFB ensures the server delivers data quickly enough to maintain that responsiveness.
To improve your site’s INP, TTFB and ultimately your revenue, consider these measures:
- Reduce JavaScript size and optimize handlers: Remove unnecessary code and simplify event processes to make interactions faster and reduce delays caused by processing large scripts.
- Defer or async non-essential scripts: Load scripts that aren’t immediately needed later, freeing up resources to improve responsiveness and reduce delays in server response.
- Simplify page layout and move heavy tasks: Minimize complex designs and handle resource-intensive tasks in the background to keep your site fast for user interactions. Optimize server configurations to respond to requests more quickly.
- Lazy load content: Load only what users need at the moment and delay other elements until required. This improves interaction speed and reduces server load.
- Preload critical assets: Use rel="preload" to have the most important files, like styles and scripts, loaded early to make interactions faster and reduce delays from waiting for the server.
3. Lead generation
Turning visitors into leads is the first step in turning interest into revenue and every second counts. To make a good first impression, you’ll need to track First Contentful Paint (FCP) and Largest Contentful Paint (LCP).
FCP measures how quickly the first piece of content appears – ideally under 1.8 seconds – while LCP tracks when the largest visible element, like a headline or hero image, fully renders. LCP should happen within 2.5 seconds or less to meet user expectations.
Fast FCP ensures users get immediate feedback, shaping their perception of your site as responsive and reliable. LCP builds on this by delivering the most important content quickly, encouraging interaction with lead-capturing elements like forms and CTAs.
LCP replaced First Meaningful Paint (FMP), which is subjective and inconsistent, attempting to guess which content users found “meaningful.” LCP focuses on the largest visible element, providing a clear, objective metric.
To improve your LCP and FCP scores, try the following:
- Optimize images: Compress and resize images using modern formats like WebP. Use responsive image techniques to serve the right size for each device.
- Use a CDN: Serve assets from servers closer to users to reduce latency and speed up content delivery.
- Preload key resources: Use rel="preload" to prioritize critical assets like hero images, fonts and CSS needed for visible content.
- Eliminate render-blocking resources: Minimize or defer CSS and JavaScript files that delay rendering. Use tools like critical CSS to load essential styles first.
- Enable browser caching: Cache static assets so returning visitors can load content faster without redownloading resources.
- Minimize third-party scripts: Limit scripts that delay rendering and load them asynchronously when possible.
4. Unique users
Knowing how many unique users visit your site is the baseline for understanding reach, engagement and potential revenue. If you want to stay on top of these numbers, look no further than Requests per Second (RPS), a surprisingly effective proxy for gauging traffic at scale.
Here’s why it works: the more users hitting your site, the more requests your server processes. While not a perfect one-to-one metric (caching, bots and background requests can skew things), RPS provides a strong correlation to user volume when analyzed over time.
For instance, a site averaging 500 RPS during peak hours is likely hosting tens of thousands of active users in real time.
Tracking changes in RPS helps pinpoint traffic spikes during campaigns or viral events, revealing user behavior patterns like peak browsing times or popular pages.
Sudden surges can signal server strain, helping you proactively scale infrastructure or optimize caching.
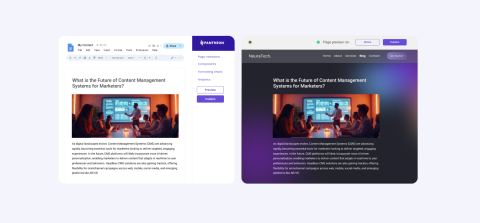
An observability platform like the one Pantheon offers streamlines performance optimization and scalability by providing real-time insights into traffic patterns, empowering you to handle spikes while delivering a fast, reliable user experience.
5. Daily active users
Daily active user (DAU) numbers show how many people are consistently finding value in your site and returning each day, providing insight into loyalty and long-term growth.
Knowing your site’s DAUs helps you assess whether your digital strategies are working and where adjustments might be needed.
To maintain or increase DAUs, you’ll need a metric like the Application Performance Index (Apdex) score.
Apdex measures user satisfaction by evaluating response times and categorizing experiences as satisfying, tolerable or frustrating. A higher score indicates better performance and happier users, while a low score signals areas where improvement is needed, such as load times or interactivity.
New Relic takes Apdex tracking to the next level, providing deep insights into how your site’s performance impacts user experience. It doesn’t just show you the numbers – it helps you understand where your site is thriving and where it’s falling short.
With Pantheon, you get New Relic as part of your workflow, making tracking, analyzing and improving effortless. It’s a powerful way to keep your site fast, your users happy and your daily active users growing.
Align your website performance with your business KPIs for growth on Pantheon
You can’t achieve high-level business KPIs without tracking the right website performance metrics.
Numbers like Cumulative Layout Shift (CLS), Interaction to Next Paint (INP), First Contentful Paint (FCP) and Largest Contentful Paint (LCP) give you a direct line to understanding and improving user experience.
Whether it’s reducing page shifts to increase ad impressions, optimizing responsiveness to boost e-commerce revenue or ensuring fast load times to convert visitors into leads, you’re begging to fail if you’re not measuring them.
Pantheon simplifies the process of tracking, analyzing and optimizing these performance indicators with full-stack observability tools built directly into its platform. Everyone, from developers to marketers, has the metrics they need to ensure they’re always acting, not just reacting.
By providing real-time traffic insights and automated scalability, Pantheon ensures your site delivers the speed, stability and responsiveness users expect – turning performance improvements into measurable business results.
Contact Pantheon today to see how we can help take your performance to the next level!