
Site Performance Insights: Drilling Deeper Into Your Traffic

We’ve launched Site Performance Insights, a way to move from fleet-level traffic signals to request-level evidence when something on your site (or across your fleet) deserves a closer look. Site Performance Insights connects two views:
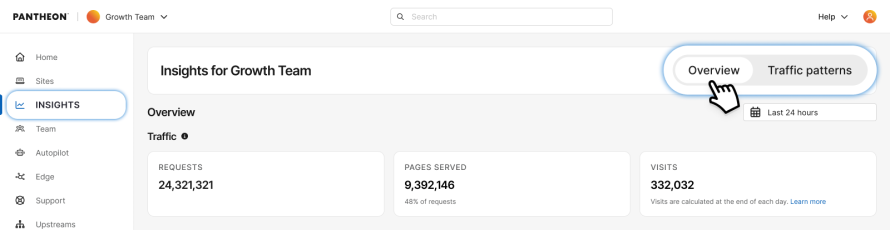
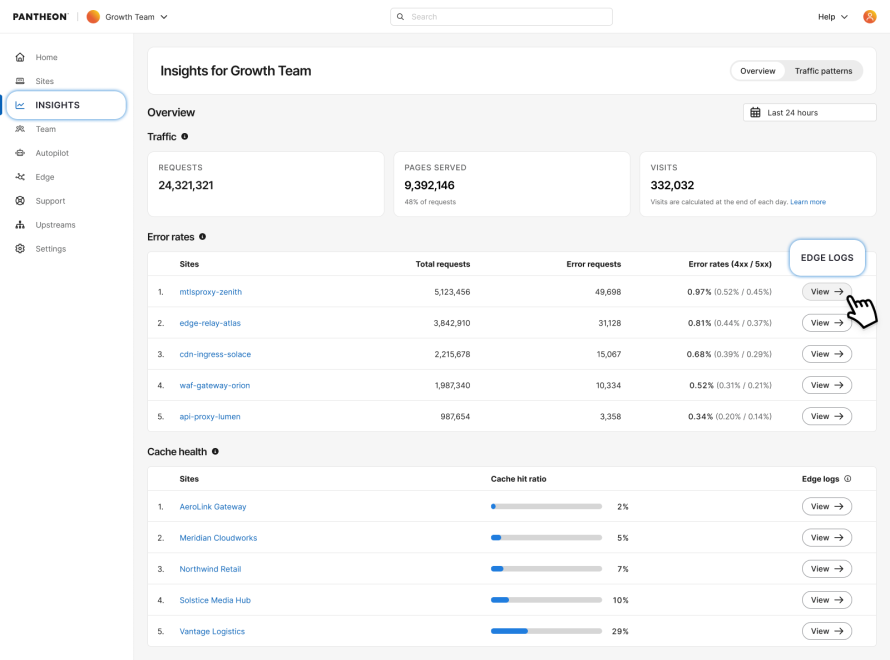
- Workspace Overview helps you identify sites with errors or caching behavior, without opening each site individually.
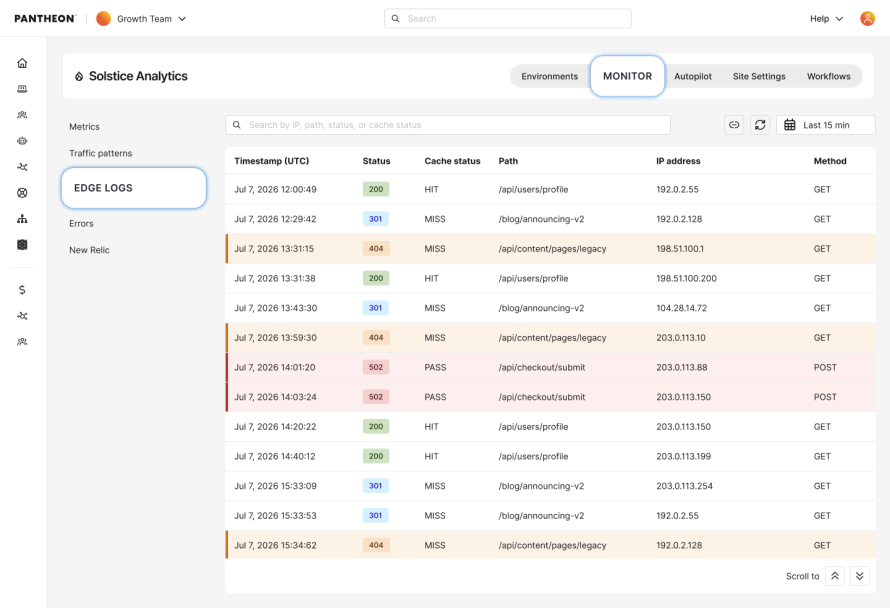
- Edge Logs lets you examine individual requests, including whether requests to your campaign page succeeded or returned errors.
Together, these views give your team evidence beyond a single successful visit: Workspace Overview shows where to look, and Edge Logs helps explain what happened.
Here’s context for when you might find these features useful. Traffic to a retail campaign page may suddenly surge without a new promotion. A nonprofit donation page may attract attention from an unfamiliar region. A university admissions site may see deadline-driven activity while a smaller program site starts returning errors.
In each case, the visible signal is only the beginning. The extra traffic could be an opportunity, a problem, or both. And the busiest site is not necessarily the one that needs help first.
You open the page. It looks fine. But “it works for me” doesn’t tell you what everyone else is experiencing or whether the spike reaches beyond this one site. Your team needs a way to see where the evidence points before changing a working site or opening every dashboard one by one.
Look where your help is needed
As we explored in our previous blog post, Fleet-Level Traffic Insights and Site Metrics help you follow a spike, investigate the sources and pages behind it, and decide what to do next. You can't drop everything to check every site. You need to know which ones deserve attention.
Alongside workspace-level requests, pages served, and visits, Workspace Overview surfaces ranked views of sites with the highest edge error rates and lowest cache hit ratios over the selected time window.
Suppose a retail campaign site is receiving most of the extra activity, but a smaller regional storefront stands out for errors. Or a nonprofit’s donation page is drawing attention while its volunteer portal returns errors. Those are reasons to look beyond the busiest site and investigate the one where customers may be running into trouble.
Image
Image
Edge Logs provides a closer look: records of individual requests and the responses they received. For example, a retail site might show repeated attempts to reach an outdated product URL that returns “not found.” Or, a nonprofit site might reveal errors on a donation form.
Those records don’t explain the entire traffic spike or identify the person behind every request. However, they give your team a specific lead: check whether a page moved, an old link needs updating or redirecting, or a form requires further investigation.
Instead of checking every site or making broad changes, you have a focused problem to investigate.
Image
More Demand Doesn't Always Mean Something is Wrong
The evidence can also help you avoid changing something that works.
Some content can be served from a saved copy, or cache. Other content needs a fresh response from your site's server. Seeing more of the latter isn't, on its own, a sign that caching is broken. The question is whether that behavior makes sense for the page.
Request data won’t explain every problem or prove that every visitor had a good experience. If requests are succeeding but customers report trouble, such as a checkout that won’t complete, a form that won’t submit, or content that fails to load, application logs or other monitoring tools may be needed. Request data gives you a better starting point, not an automatic diagnosis.
Keep the Focus on the Traffic Trying to Get Through
Site Performance Insights helps your team focus on the issues that could stand in their way. Whether the right response is a fix, further investigation, or no change at all, you can spend less time guessing and more time helping people take that next step.
Workspace Overview and Edge Logs require sites to be on Pantheon's next-generation Global CDN. Edge Logs covers live traffic and retains data for 24 hours. For access instructions and technical details, start with the Workspace Overview guide and Edge Logs guide.
Tell us what your team needs to see more clearly in the Pantheon Customer Community.
