
From Fleet-Level Signal to Site-Level Action: Understanding What Drives Your Traffic
Image
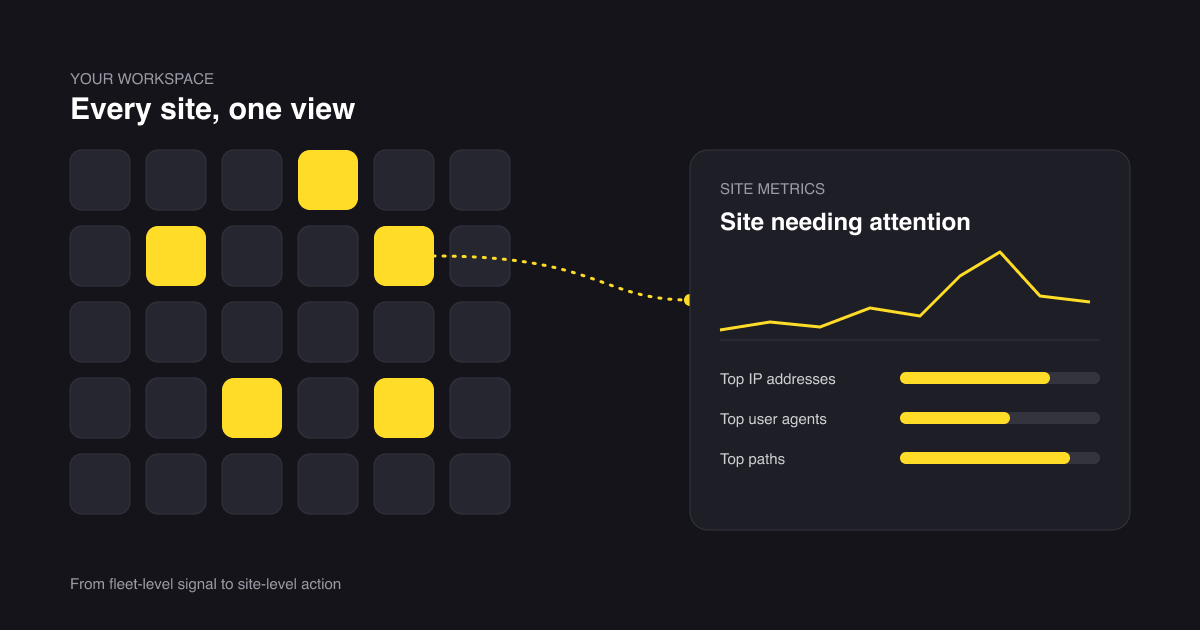
It’s Monday morning, and traffic is up sharply on one of your sites. It could be due to a successful campaign, a search crawler, or an AI bot. Your web team’s on it to find out what’s behind it.
Getting that answer usually means digging through CDN logs, decoding user-agent strings, researching IP addresses, and comparing separate reports. If you manage many sites, you first have to figure out which site to look at.
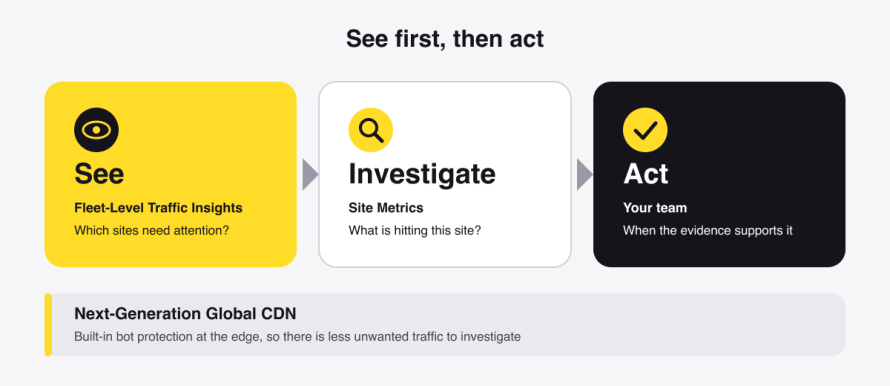
Pantheon has shortened that path. Organizations run fleets of sites, but most tools still make teams work one site at a time. Pantheon connects the steps:
- Fleet-Level Traffic Insights shows edge traffic across your workspace in one view, so you can see where to look.
- Site Metrics shows what’s reaching a specific site, where it’s going, and what’s driving usage, so you can investigate.
- Manage Traffic carries what you found into a request, so you can act.
Alongside these, Next-Generation Global CDN adds built-in premium bot protection at the edge, helping reduce unwanted traffic before it reaches your site. Protection and visibility work together: the edge handles what it can, and these tools show you what still needs attention.
Open Fleet-Level Traffic Insights in your Pantheon workspace and see how quickly you can move from fleet-wide signal to site-level action in these three steps:
- See the traffic pattern across your fleet.
- Investigate what’s driving the traffic spike on the affected site(s).
- Act with the context already in hand.
See: Spot the Signal Across Your Fleet
Image
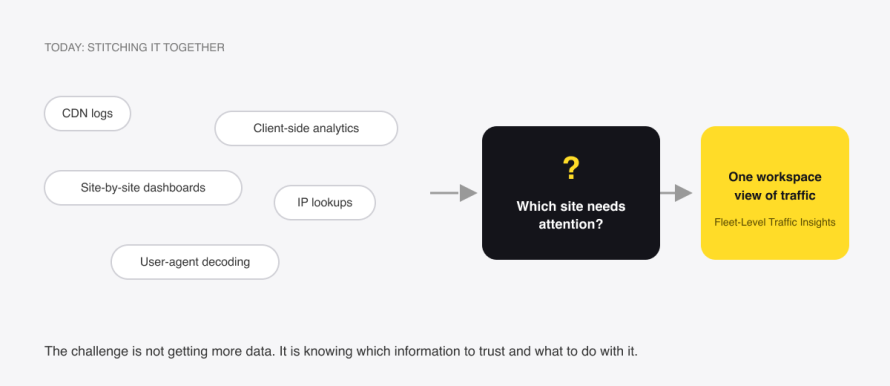
Most web teams already have traffic data. The harder part is knowing where to look first.
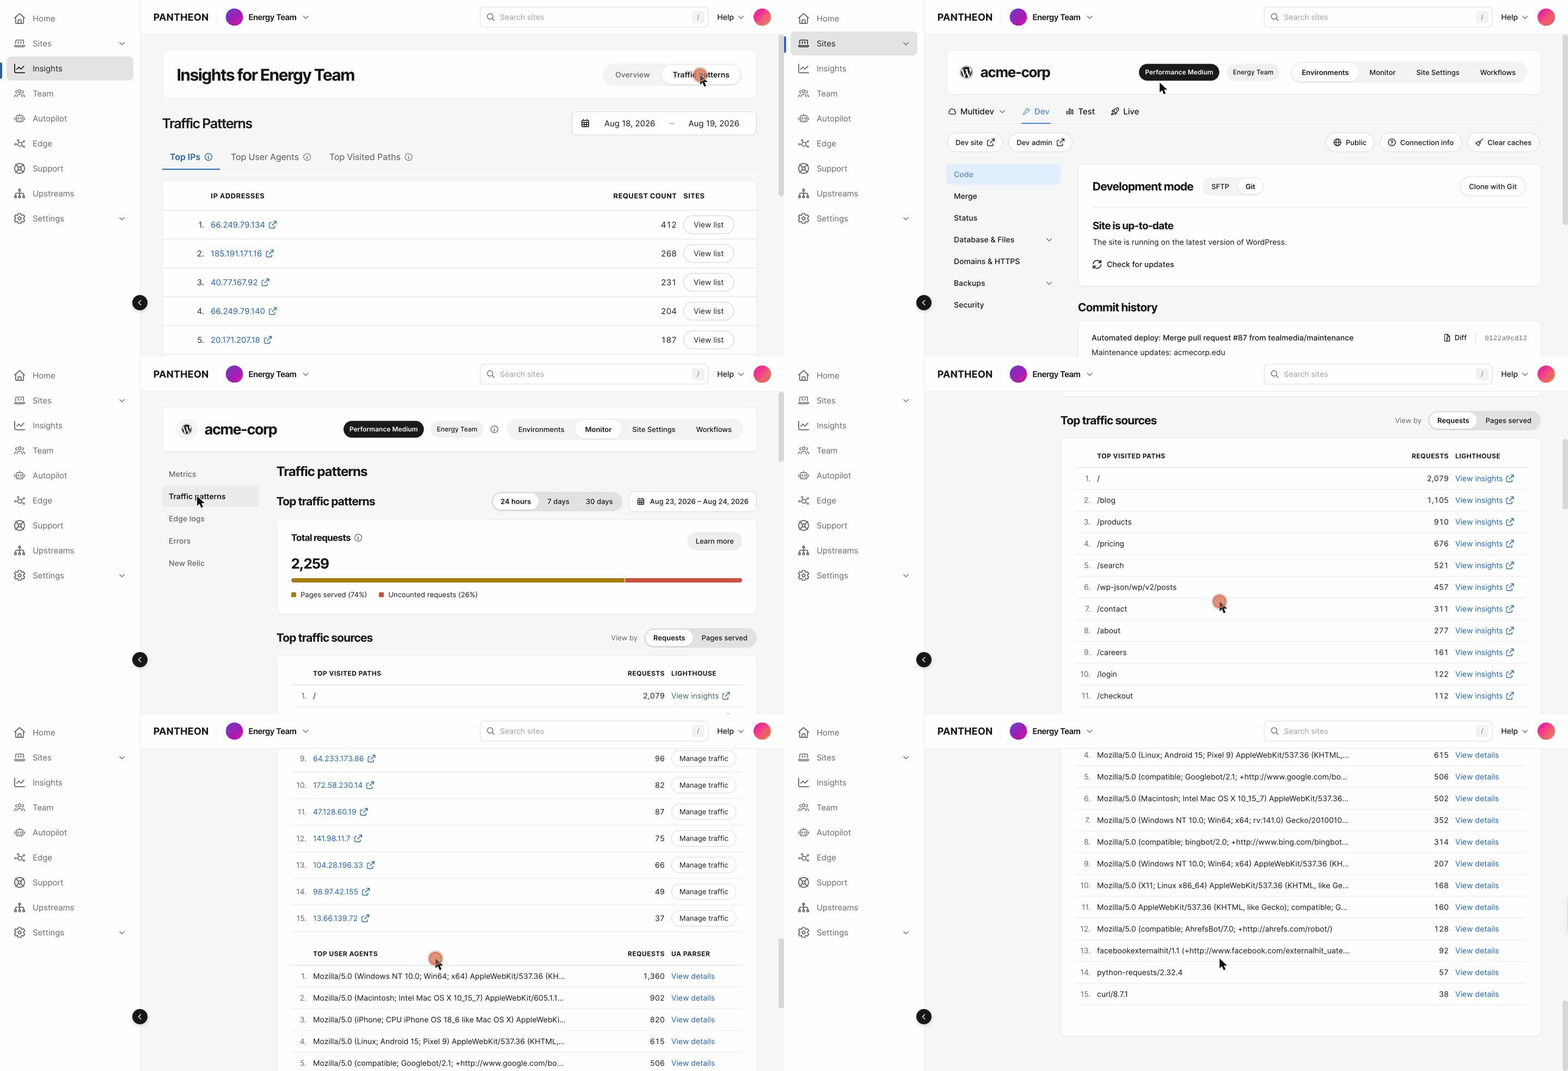
Fleet-Level Traffic Insights brings top IP addresses, user agents, and paths into one workspace view. Instead of opening Site Metrics one site at a time, you can see which sources appear most often and which sites are receiving that activity.
The fleet view matters because patterns hide at the single-site level. Ten requests from one source to one site may look like noise. The same source showing up across a large fleet may be worth a closer look.
At this stage, you’re answering a few simple questions:
- What are the leading traffic sources across the workspace?
- Which user agents and paths appear most often?
- Which sites are associated with an unusual source?
Image
Investigate: Find Out What’s Behind Traffic Spike in Four Steps
Image
Once you know which site(s) need attention, Site Metrics will give you the details. The investigation works best as a sequence of four steps.
1. Start with the patterns. In the site’s Live environment, you’ll see the leading IP addresses, user agents, and visited paths. Each adds a different clue:
IP addresses show where requests originate.
User agents hint at the browsers, crawlers, bots, or other clients making them.
Visited paths show which pages or endpoints are getting the activity.
If the most visited path is a campaign page you just promoted, the spike may be exactly what you hoped for. If an unfamiliar source keeps requesting an unusual or resource-intensive path, it deserves a closer look. The dashboard doesn’t decide whether traffic is good or bad. It gives you the context to decide.
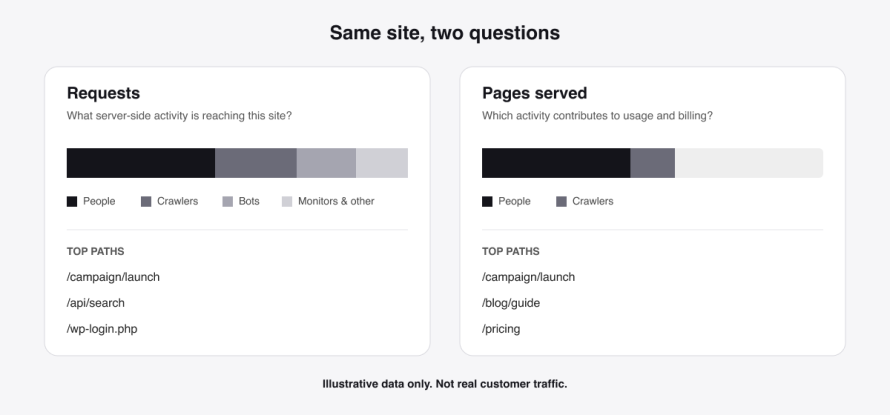
2. Separate requests from pages served. This is one of the most useful distinctions in Site Metrics.
Requests represent the broader volume of server-side traffic reaching a site, including people, crawlers, bots, and other automated clients.
Pages served narrows the view to activity that contributes to Pantheon usage and billing. This view is only available for sites on Pantheon’s Next-Generation Global CDN.
Toggling between the two helps you ask: What is reaching this site? And which of it is contributing to usage? This is about clarity, not a promise that reviewing the data will lower a bill. The gap between the two views also shouldn’t be read as traffic that was blocked.
3. Add context without starting from scratch. Selecting an IP address opens a pre-filled AbuseIPDB report with details like ownership, geographic location, autonomous system number, and prior abuse reports. The in-dashboard user-agent parser breaks long, technical strings into browser, device, and operating system. Neither is a verdict. An unfamiliar IP isn’t necessarily malicious, and an automated user agent isn’t necessarily unwanted, because search engines, monitoring tools, and integrations all generate automated traffic. The point is to give you more context before you decide.
4. Check the experience. From a visited path, you can open related insights on browser experience and site speed. That connects “where is traffic going?” with “how are those pages performing?” and helps you decide whether the next step is traffic management, performance work, or both.
Act: Carry the Context into the Next Step
Image
After you’ve confirmed a certain source is worth acting on, you shouldn’t have to start over.
For sites with Advanced Global CDN (AGCDN), Site Metrics lets you take action on IPs, such as rate-limiting or blocking them.
Sites without AGCDN are defaulted to regular GCDN for broad, automatic bot protection. AGCDN adds granular controls for IPs, scrapers, geographies, WAF rules, and specific paths.
Not every pattern calls for action. Sometimes the result of an investigation is “this is expected,” and that’s a good outcome too. You’ve replaced a guess with a decision.
What’s Next
This is just the start. We’re working on clearer separation of search crawlers, AI bots, and human visitors, deeper edge activity and logging, and the ability to allow or block traffic directly from the Dashboard.
Roadmap items can change, so check out the Pantheon roadmap for the latest.