Platform vs. DIY Speed Analysis
Image

Every engagement metric from content reach to conversions is downstream from site speed. Good performance means good user experience, and expectations are ever rising. Research from Google estimates that most sites lose half their mobile visitors while the page is loading.
In light of this, I wanted to see what the numbers actually showed for how our platform (and others) measured up. Speed is one of our core value propositions, but does Pantheon actually deliver?
Luckily, this is an answerable question. Earlier this year I published some analysis of WordPress site speed on Pantheon using neutral third-party data. This fall, I was able to return to that research to take a broader look at the state of web performance for sites running on an optimized platform, vs. more vanilla or DIY infrastructure.
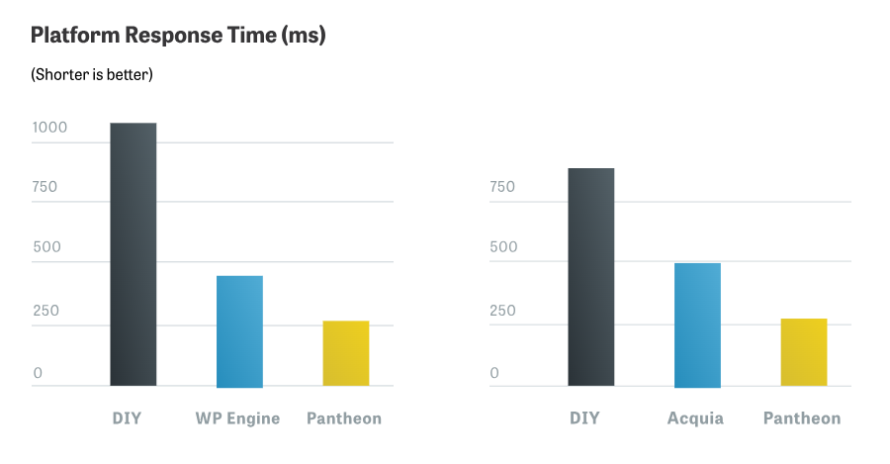
The results were unambiguous: compared to managed platforms, DIY infrastructure (including self-managed AWS instances, VPS’s, and commodity shared hosting) is significantly slower, and delivers meaningfully poorer user experiences as a result. I was glad to see Pantheon at the head of the class, but the stand-out finding is a gap between DIY and any platform. The difference there is more than double that of us vs. our competitors.
Image
TL;DR - if you're doing it yourself, you may be doing it wrong. You may not be saving any money and worse you could be paying a tax on all your other metrics in the form of user abandonment and frustration. If you want a report on your site's performance right now, use our handy speed test tool, or keep reading for more details on the impact of this data, as well as how we compiled the numbers.
The Data
To measure the raw speed of underlying infrastructure, we used the HTTP Archive dataset's time to first byte (TTFB) metric. This measures the time it takes for the first byte of web content to come over the network - the start of the rest of the performance race. From here on out, page composition and complexity, as well as the content itself, will have a significant impact on the user experience. TTFB is a pure measure of backend/platform performance.
Image
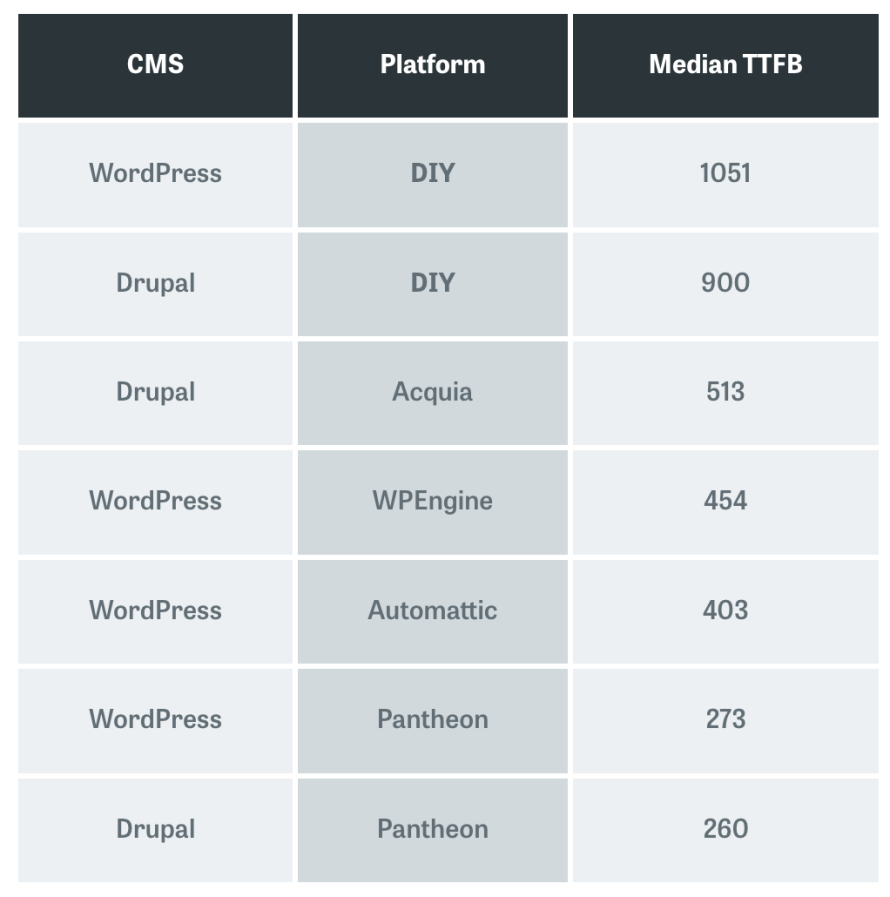
What we see here isn't pretty for the world of DIY. The median TTFB for both WordPress and Drupal sites is nearly a second; ideally, you would want your page loaded and in front of the user by that time. Instead, they're just getting the first byte of data to the browser.
From a user experience standpoint, this is a full second spent wondering if there's even anyone home. There will be many more requests and a fair bit more waiting before any content is actually visible. And keep in mind we're using medians here; many sites in the DIY category take several seconds or more just to deliver. Not great.
To better understand the impact on user experience we turn to a different source, the Chrome User Experience (CrUX) dataset. While the HTTP Archive is the result of tests run on controlled hardware and networks — laboratory data, if you will — CRUX is compiled from users who opt in to sharing diagnostic and performance data from the Chrome browser. This means real-world CPUs, networks, latency, and more are all included in the results.
For this analysis, we used Rick Viscomi's method for bucketing the sites into categories of fast, average, and slow. After applying our platform filters the outcomes aren't quite as stark as our TTFB findings, but they're still quite clear:
Image
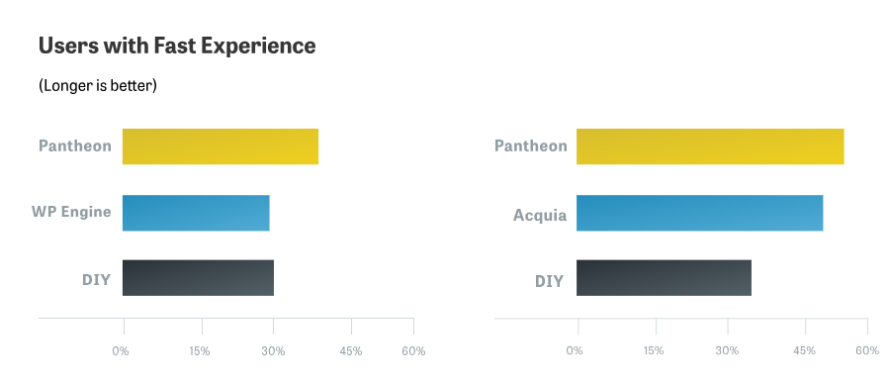
Pantheon can't prevent slow user experiences entirely, as this still depends on the composition of the website and its content. However, if you start building your page nearly a full second sooner, you will end up with faster user experiences. Based on this data, using a platform will give 10% more users a fast/delightful experience, while DIY risks completely frustrating and turning off another 6% with a slow experience.
There's also an interesting gap here between Drupal and WordPress. Even comparing the DIY numbers, the gap in experiences is more than I would have expected given the TTFB data being so close. It's possible that this reflects Drupal's built-in CSS and JavaScript aggregation, which can give a material boost to front-end performance, but that's just a theory. This is an area that deserves more study.
Conclusion
It's clear that WordPress and Drupal are much better off in general on a platform vs. being self-managed. If you have a website on a mission and you're running on a generic host or your own cloud infrastructure, you should be aware of your site performance, and its implications in terms of hitting your goals.
If you want to deliver a better user experience, you'll not only need to measure it, but also build consensus around its value. That means making the case for better site performance with data.
The same diagnostic tool that powers the HTTP archive is available at webpagetest.org, and you can inspect your browser's own performance report in the developer console to get the same data as in the CRUX results (at least for your location/network). However, if you're looking for something easier to read, or that you can share with less technical stakeholders, check out Pantheon's website speed report.
Methodology
Both the HTTP Archive webpage performance data and CRUX dataset are freely available for anyone via Google's awesome BigQuery data analysis engine. You can recreate these findings for yourself, or use them as a starting place for your own analysis.
The first thing we did was fingerprint the platforms we wanted to examine. Because the HTTP Archive data-set contains every minute detail of each request, we're able to use HTTP headers, DOM elements, and many other elements to identify where a given website is running, and what technologies are in play. For example, you can definitively tell if a site runs on Pantheon if a response contains a x-pantheon-styx header. Here's the query I developed for platform fingerprinting:
To keep things manageable, we ended up restricting the "platform" category to ourselves and our top competitor for both WordPress and Drupal sites: WPEngine and Acquia, respectively. I did spend some time initially looking at other platforms (e.g. Platform.sh, Pagely) but found there were not a large number of them in the data-sets. For ourselves and the main competitors, there were thousands of sites with data to compare, which gave me confidence in the validity of the data.
From that point, it was a straightforward process to construct a fingerprinting query against the HTTP Archive requests details data, which I then used to build a table of domains and what platform they run on. Once that platform-mapping table was in place, I used it to query other data-sets within HTTP Archive and CRUX for performance analysis.