Pantheon Speeds Up WordPress By 3x
Image

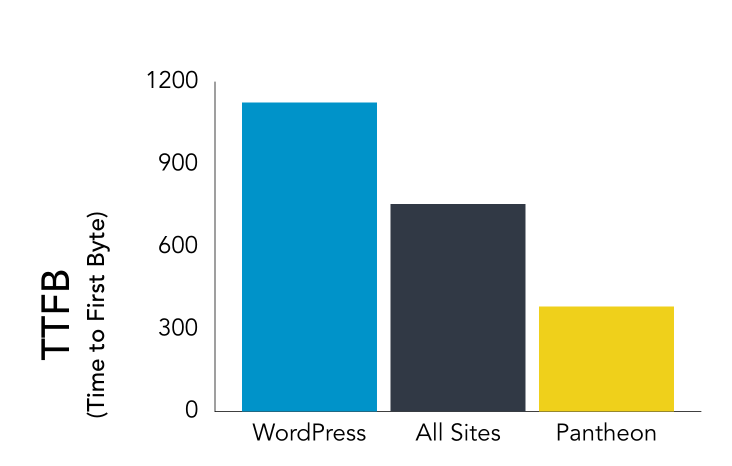
Using the HTTP Archive—presented by Google at WordCamp US—which tracks detailed performance data for hundreds of thousands of sites in the Alexa top 1M, I was able to show that the median WordPress site on Pantheon is 3x faster than elsewhere:
Image
The metric used here is time to first byte (“TTFB”) which is crucial for website performance, both in terms of user experience and every other business outcome. Faster TTFB is associated with everything from improved SEO results to content engagement and even conversions and online purchases.
Also, from this dataset we see that WordPress’s performance (outside of Pantheon) is generally slower than the average website. This explains concerns in the market about WordPress’s speed, but also shows that this isn’t really a problem with the CMS itself.
TL;DR: WordPress is blazing fast when you have the right infrastructure. However, one of the downsides of running 27% of the web is that sometimes you might not.
That’s what we aim to change at Pantheon, and it’s great to have independent validation of all the hard work we put into optimizing website speed. I’m proud to share my methodology and detailed results with all of you.
The Backstory
At this year’s WordCamp US in Nashville, there was an interesting new sponsor and booth: Google. Their booth had two sides: one introducing the new Tide project—a community effort led by XWP to improve code quality that’s worthy of its own blog post—and one that used HTTP Archive data to explore WordPress’s impact on the web at large.
The HTTP Archive project has been amassing WebPageTest scores for hundreds of thousands of sites pulled from the Alexa top million for several years. Looking at the subset of those sites powered by WordPress vs the rest yielded some very interesting results. Among their findings:
WordPress seems a bit slower on initial response than average (more on this later)
WordPress scores higher on Accessibility ratings
Images on WordPress sites are more highly optimized
It’s a really rich dataset, and in addition to mining it for some high-level graphs and insights at the conference, they also make it available as a Google BigQuery public dataset, so people can analyze it on their own. That’s what I used to produce these results.
“Performance Is User Experience”
Google’s booth said, “Performance Is User Experience,” and I strongly agree. Study after study has shown page speed significantly impacts customer engagement and conversion rates, up to and including completing a purchase. Up to 79% of customers who are dissatisfied with a website's performance say they're less likely to buy from the same site again.
Savvy website operators keep a close eye on performance, and improve it wherever possible. Delivering great user experiences with high speed responses has been core to Pantheon since the very beginning. Our mission is to prove that open source websites can deliver the best results, even under eye-popping traffic.
The seeds of our platform were planted when we set a new standard for PHP CMS performance by publishing an open source Amazon Machine Image (“Mercury”) that delivered a turbocharged LAMP stack + Varnish. Over the years, we’ve done quite a lot to prove that both Drupal and WordPress can be super fast and handle internet-scale traffic, providing they have the right platform and high quality code.
Discovering the HTTP Archive provided me with a new opportunity: to prove that our work is paying off using independent data. Basically, you don’t have to take my word for it—anyone who cares to can replicate my results. My methodology is explained fully at the end of this post.
Platform Speed: Time to First Byte
Time to First Byte (TTFB) is a key metric for anyone interested in web performance. It measures the time between a user starting an interaction—e.g. clicking a link— and the browser receiving the first byte of real content back. It’s the foundation for all user experience.
Given the spread in the numbers and the length of the long tail, the median/50th percentile is a better way to look at performance vs the average. Thanks to Ilya Grigorik for that suggestion. Here are the median TTFB results for WordPress sites vs other HTTP Archive tracked site:
Image
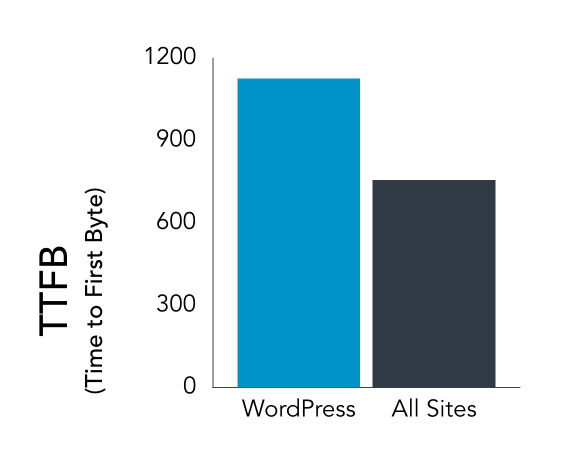
So the median WordPress site is almost half a second slower in delivering the first byte of content, an unfortunate result. The time it takes for a site to deliver content to the browser sets the “floor” for what the customer experiences in terms of speed.
TTFB matters for non-human users too. Google has been open about factoring in website speed as measured by their crawlers as a part of how they rank pages. Along with boosting results for sites running under HTTPS, this is another example of them “throwing their weight around” in using their ranking algorithm to drive a higher quality web.
As with all things related to the search algorithm, they aren’t specific about what they measure or what exact impact it has. However, independent research by Moz suggests that TTFB is a metric they evaluate, and that faster results (down to a minimum of 500ms) result in improved rankings.
Stacking Up Pantheon
The above result explains the annoyingly persistent fear in the market that “WordPress is slow.” My hypothesis going into this was that WordPress often runs on relatively poor infrastructure: overcrowded shared servers, un-tuned VPSs, even managed setups without premium caching, etc. Since TTFB is largely driven by platform and infrastructure quality, I was expecting Pantheon to measure up well.
Given WordPress’s relatively poor median TTFB, it became all the more urgent to see what difference Pantheon made. If I could show that WordPress + Pantheon is faster, I'd have a solid proof-point that WordPress as a CMS is perfectly capable of being fast. It just needs the right platform.
My results did not disappoint. As you saw in the graph at the top of this post, WordPress sites on Pantheon enjoy a median TTFB of just about 350ms, nearly a full second improvement over WordPress sites elsewhere. In addition to showing the power of Pantheon, it also signals how FUD around WordPress performance is largely driven by low-quality platforms (aka the high cost of cheap hosting) and the CMS itself.
But the median number doesn’t tell the whole story. To go further, I broke the results down by 100ms buckets, which paints an even more very interesting picture:
Image
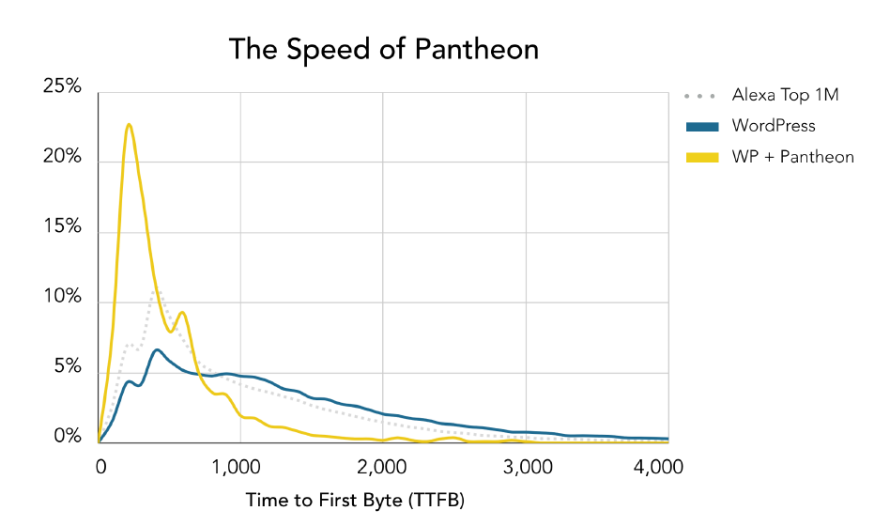
This more detailed view shows how Pantheon dramatically improves the speed of WordPress websites. The yellow line is our sites, almost all of which have a sub-second TTFB, and fully a quarter of which are coming in around 200ms. This is the foundation for a truly amazing user experience, and for truly amazing website results.
Likewise, you can see the unfortunate “long tail” of non-Pantheon WordPress sites, which to be fair is only slightly slower than the rest of the sites in the dataset. This fat long fail represents the performance of WordPress sites on unoptimized platforms, which is unfortunately common, even for important websites. The fact that anybody in the Alexa Top 1M is willing to settle for a multi-second TTFB boggles my mind, but the numbers don’t lie.
How We Deliver These Results
In addition to showing Pantheon being quite fast overall, the shape of this graph is interesting. I have some theories on what drives the two "peaks" at the head of the graph.
The first peak at 200ms is almost certainly people using the Global CDN to its fullest, via our Advanced Page Cache plugin. This fits with internal research we did this summer when the Global CDN was first released, and I can’t think of any other way to make your website this fast.
The second spike is likely sites that aren’t taking advantage full of our page caching, but are using PHP 7.x and don’t have any slow queries tied to their homepage. Under those circumstances, WordPress is a pretty high-performance app! When looking at WP performance in New Relic it's not uncommon to see sites turning around transactions with under 500ms. TTFB still includes network travel on top of that, which is why I think the spike around the 600ms bucket makes sense.
This group could be doing better. Every site on Pantheon gets our Global CDN, and missing out on its benefits is almost always a result of misconfiguration or mis-behaving code. The most common causes are promiscuously starting a PHP Session, or simply failing to send the correct caching headers. Our support team is highly experienced at troubleshooting these problems, so reach out if you think you might need a hand.
How I Did It: BigQuerying the HTTP Archive
You don’t have to take my word for any of this. The data is all publicly available, and these results can be re-created by anyone who wants to spend a few hours getting to know Google’s BigQuery data analysis tools. There’s a lot more that can be discovered with this data-set, so I hope that this can inspire others to find their own performance insights as well.
Luckily we already use BigQuery a fair bit at Pantheon, so I’m familiar with the tool (it’s awesome). I also don’t have to worry about staying within the bounds of the free analysis tier, and could afford to do a fair amount of exploratory analysis.
The first step was to recreate some of the analysis that Google’s team was showing at the conference. Their Discourse thread on the WordPress Ecosystem has some helpful tips for getting started.
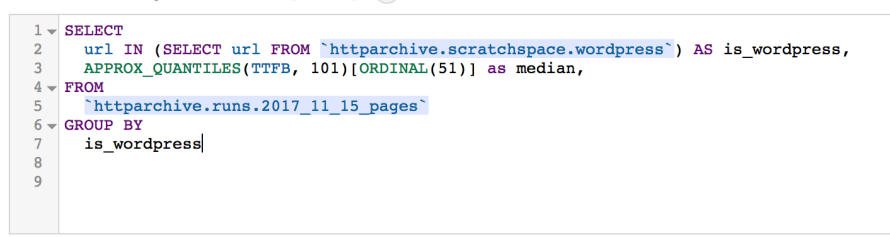
I’m using BigQuery’s handy APPROX_QUANTILES method, which lets you efficiently break a big dataset into quantile groupings. I’m creating 101 quantiles (which should give us a 1% margin of error) and grabbing the 50th:
Image
That gave me overall outcomes for TTFB. Then I had to zero on not just on whether a site was running WordPress, but also whether or not it was powered by Pantheon.
Initially I looked at identifying Pantheon sites based on telltale HTTP headers (yes, you can query down to the header level in this dataset). This has a lot of other potential applications in terms of creating sub-populations, and to be honest it turned into a bit of a yak-shave.
In the name of expedience, I took a quick-and-dirty approach: exporting a complete list of hostnames from our internal Business Intelligence database and loading that into my own private area of BigQuery as a CSV. It took all of 10 minutes, and from then on it was dead simple to mash up the data and look for matches.
I built this graph by rounding the TTFB to the nearest tenth of a second, and then counting sites in each bucket and then visualizing those as a percentage of the total. The only challenge I had was normalizing between hostname and fully qualified url, which includes http/https.
Image
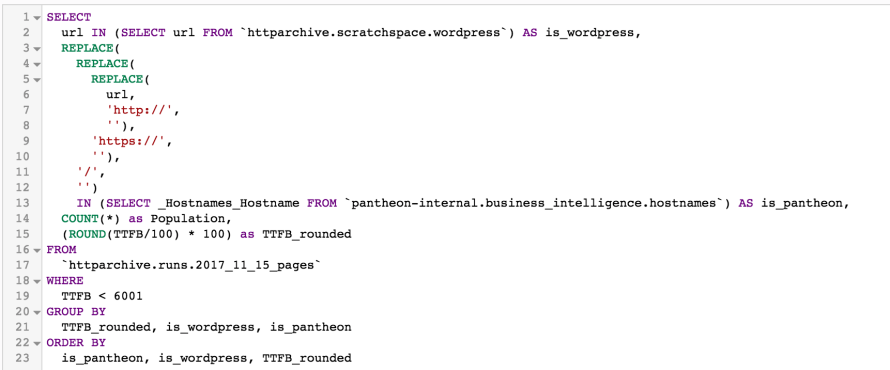
Combining this kind of in-query data normalization with a data-set containing millions of entries can crush a normal relational database. I love how BigQuery lets me write things that would never perform in MySQL, and not worry about the back-end resources needed to generate the result.
There’s a lot more research to be done. My next goals will be to examine the same dataset for Drupal sites, and to dig deeper into the HTTP Header and DOM data to see if there are any recognizable plugin or infrastructure signals that help explain the results further.